
The U.S. outpaced every G7 peer in 2026 economic growth, driven by massive tech spending, record domestic energy output, and heavy federal borrowing. Behind those headline numbers sits a sharp divide over who captured the gains and who paid the price.
Reports from the International Monetary Fund and the Bureau of Economic Analysis confirm brisk American expansion through the third quarter. Yet steep fuel costs and the cost of living sparked a decisive voter backlash in November.
Following the money reveals how corporate capital, federal tax law, and energy exports kept the U.S. ahead. You can verify these trails yourself through public budgets and financial disclosures.
The 2026 Flashpoint: Record Growth Meets a Voter Backlash
On the surface, the American economy posted numbers that other wealthy nations could not match in 2026. In its October 13 World Economic Outlook, the International Monetary Fund projected global real GDP growth to slow to 3.1 percent, down from 3.5 percent in 2025.
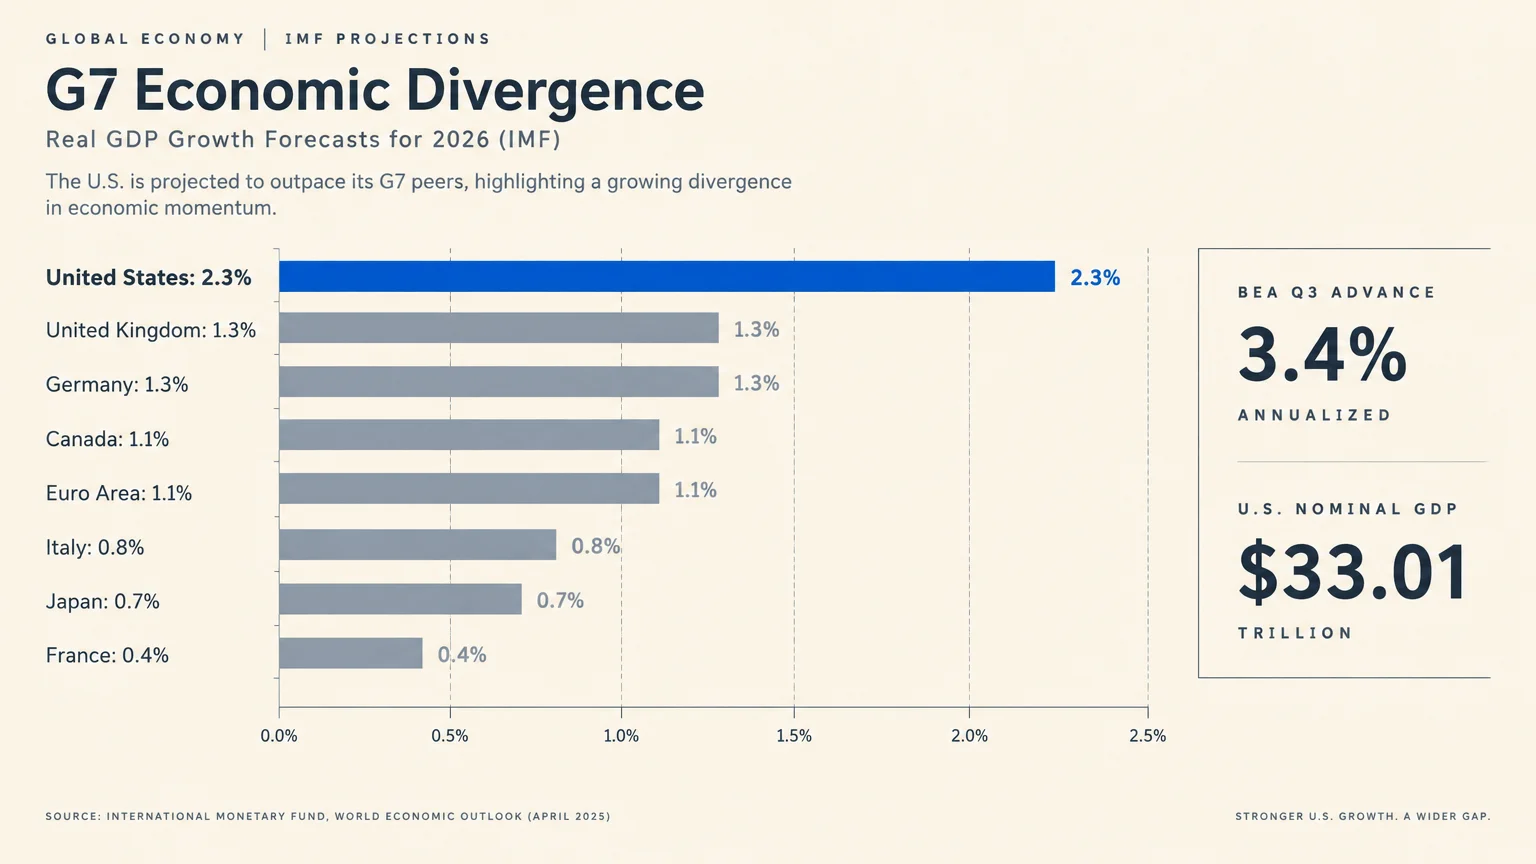
Within that cooling global picture, the IMF forecast 2.3 percent real GDP growth for the United States. That figure beat the 2.1 percent advanced-economy average and outpaced every other G7 member by a wide margin.
Look at the G7 gap reported by the IMF: the United Kingdom and Germany each stood at 1.3 percent, while Canada and the Euro area sat at 1.1 percent. Italy trailed at 0.8 percent, Japan at 0.7 percent, and France at just 0.4 percent.
Faster percentage growth belonged only to major emerging markets, where the IMF projected 3.7 percent expansion overall. India led at 7.0 percent and China held at 4.5 percent, though neither operates at America’s total dollar scale.
The Organisation for Economic Co-operation and Development painted a similar divide on September 23, 2026. The OECD projected 2.9 percent global growth, placing the United States at 2.2 percent against 1.0 percent for the Euro area and 4.5 percent for China.
Instead of fading midyear, domestic output accelerated as federal tax changes and corporate investment kicked in. According to the Bureau of Economic Analysis, U.S. real GDP grew at an annualized 2.5 percent in the first quarter and 2.2 percent in the second.
By the third quarter, BEA’s October 29 advance estimate showed real GDP surging at an annualized 3.4 percent, beating consensus expectations of 3.1 to 3.2 percent. Consumer spending jumped 3.8 percent, while real final sales to private domestic purchasers climbed 4.9 percent.
That surge pushed nominal annualized U.S. GDP to $33.01 trillion in the third quarter, according to BEA data tracked by the St. Louis Fed. Yet just five days after that October 29 report, voters delivered a blunt verdict at the ballot box.
On November 3, 2026, Democrats swept both chambers of Congress with a projected 54 to 55 Senate seats and more than 240 House seats, according to Allianz and Moneyweb reporting. Democrats also flipped governorships including Texas, setting up divided government for January 2027.
Voter discontent centered on high gas prices, daily living costs, and the conflict involving Iran. That split between rising GDP and household frustration is your starting clue to follow the 2026 money trail.
Source Map: Tracing the Dollars Behind U.S. Expansion
Aggregate GDP totals mask where capital originated and which sectors absorbed it. To see how the U.S. pulled ahead of Europe and Japan, you need to map three massive financial engines: tech hyperscalers, the federal Treasury, and domestic oil and gas producers.
The $800 Billion AI Infrastructure Wave
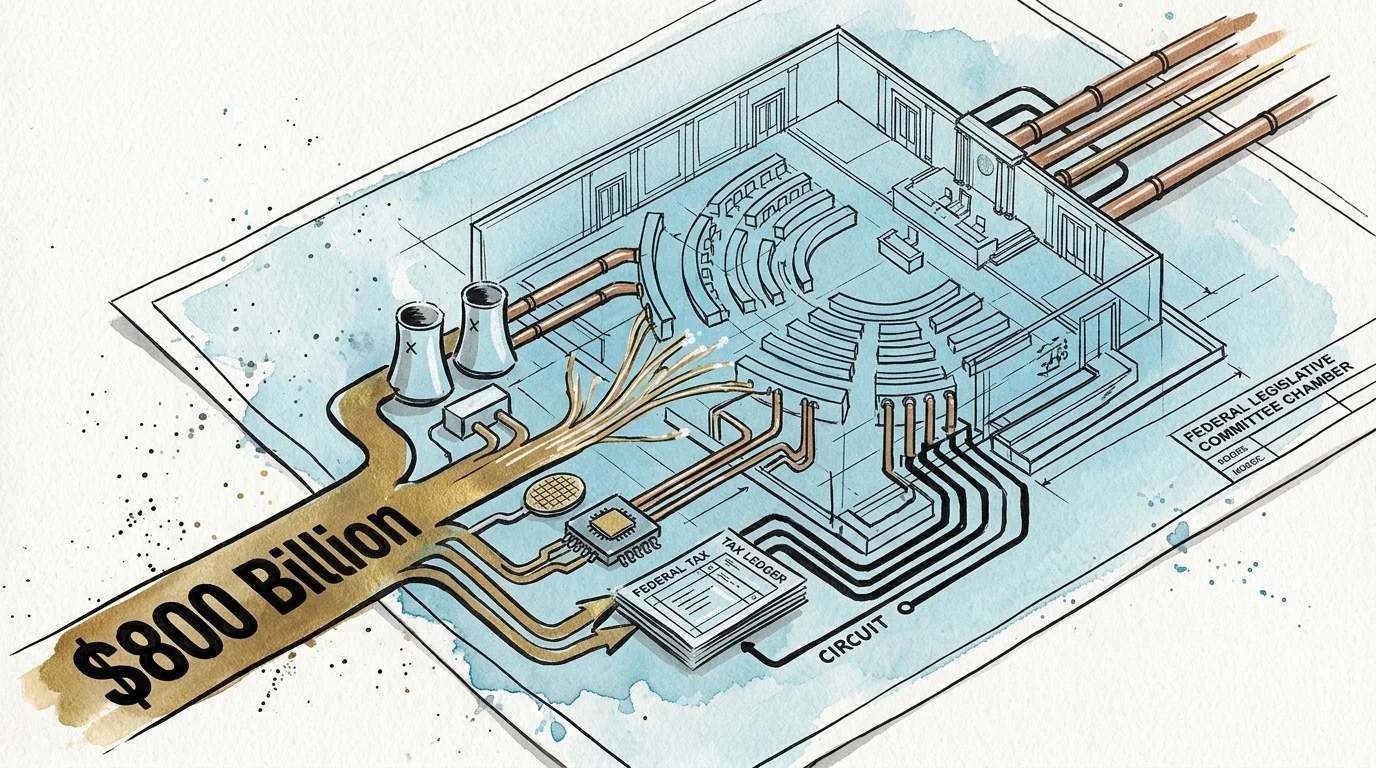
Private technology capital acted like a second fiscal stimulus across American manufacturing and construction in 2026. Capital Economics estimated in November 2026 that top U.S. tech hyperscalers are spending roughly $800 billion this year, double the prior year’s pace.
Four corporations drove the bulk of that spending spree. FactSet and FXCM data from September 2026 show Amazon, Alphabet, Meta, and Microsoft raised their combined 2026 capital expenditure targets to between $720 billion and $745 billion.
To put $745 billion in context, those four companies deployed more than one-third of the entire FY 2026 federal deficit in a single calendar year. That concentrated capital reshaped quarterly national output almost overnight.
Third-quarter business capital expenditures jumped 12.7 percent, led by a 20.9 percent surge in equipment spending. Summit Global Private Wealth calculated in November 2026 that artificial intelligence accounted for nearly 60 percent of that quarter’s capex gain.
Factory floors felt the ripple effects immediately. On September 23, OECD Secretary-General Mathias Cormann reported that U.S. computer and electronics production grew 12 percent over the 12 months through July 2026, more than ten times faster than other industries.
Cormann also noted that nearly two-thirds of global goods trade growth stemmed from tech and AI demand. The IMF warned that global expansion has grown unusually narrow, with roughly 95 percent of 2026 growth coming from just 32 economies down from 54 in April.
When you inspect corporate 10-K filings and quarterly earnings releases, track whether those hyperscaler dollars went to domestic hardware suppliers or overseas chipmakers. That paper trail tells you how much AI capital stays inside U.S. payrolls.
Federal Fiscal Fuel and a $2 Trillion Deficit
While Big Tech wired hundreds of billions into data centers, Washington pumped trillions in borrowed cash into household and corporate bank accounts. On November 9, 2026, the Congressional Budget Office budget reports confirmed a $1.992 trillion federal deficit for fiscal year 2026.
That shortfall—roughly $2.0 trillion for the year ending September 30—rose by $217 billion, or 12 percent, above fiscal year 2025. It equaled 6.2 percent of GDP, far above the 50-year historical average of 3.8 percent.
The primary legislative engine behind those outflows was the One Big Beautiful Bill Act, Public Law 119-21, enacted on July 4, 2025. That statute permanently extended 2017 individual tax cuts while adding tip deductions, overtime deductions, and expanded business expensing.
At the same time, the law cut Medicaid, Affordable Care Act credits, SNAP nutrition benefits, and clean-energy credits from the Inflation Reduction Act. Those shifts redirected federal support away from safety-net and green-subsidy recipients toward wage deductions and corporate equipment write-offs.
Heavy borrowing rapidly inflated the national balance sheet. U.S. Treasury data show federal debt held by the public hit 100 percent of GDP—the highest share since 1946—and reached $32.7 trillion by the end of October 2026.
Servicing that debt consumed a massive slice of taxpayer revenue before Congress funded a single new program. Interest payments on the federal debt exceeded $1.14 trillion in fiscal year 2026, and October 2026 alone added another $404 billion monthly deficit.
Watchdog readers can verify these exact monthly cash inflows and outlays in the Monthly Treasury Statement. Comparing corporate tax receipts against individual withholding shows you which groups received the largest net relief under P.L. 119-21.
Domestic Energy Output as an Economic Shield
Geopolitical turmoil in 2026 exposed a stark economic divide between energy importers and energy producers. Conflict involving the United States, Israel, and Iran disrupted tanker transit through the Strait of Hormuz, a chokepoint that previously carried roughly 20 percent of global oil and liquefied natural gas.
According to November 2026 figures from the U.S. Energy Information Administration energy statistics, Brent crude averaged $124 per barrel in October 2026. That marked the highest inflation-adjusted oil price since July 2022, with full-year Brent forecast to average $97.44 per barrel.
American drivers and truckers absorbed a sharp hit at the pump as retail diesel topped $6 per gallon in October. Yet on a macroeconomic level, record domestic extraction shielded U.S. industry from the supply freeze hitting Europe and Asia.
The EIA projects U.S. crude oil production will reach a fourth consecutive annual record of 13.8 to 13.9 million barrels per day in 2026, up from 13.7 million in 2025. That volume turned the United States into a net exporter of more than 4 million barrels per day.
The price gap in natural gas proved even more dramatic for industrial competitiveness. EIA and S&P Global data from November 2026 show domestic natural gas prices held near $3 per million British thermal units while European and Asian buyers paid over $30.
U.S. energy exporters capitalized immediately on that tenfold price spread. American LNG exports jumped 23 percent year-over-year to 17.4 billion cubic feet per day during the first half of 2026, pulling foreign revenue straight into U.S. Gulf Coast terminals.
Influence Mechanisms: How Capital Flows Reshaped Policy
Dollars do not shape national growth in a vacuum; they move through tax statutes, trade rulings, and central bank decisions. Understanding those transmission channels shows you how industry priorities and emergency shocks translated into 2026 policy shifts.
Tax Code Incentives and Trade Policy Pivots
When Congress wrote business expensing and overtime deductions into P.L. 119-21, it created immediate incentives for firms to accelerate 2026 equipment purchases. Combined with AI demand, those deductions help explain why Q3 business equipment spending leaped 20.9 percent.
Trade policy followed a far more turbulent legal path across 2026. On February 20, the U.S. Supreme Court struck down the administration’s tariffs imposed under the International Emergency Economic Powers Act, forcing refunds of most of the $166 billion already collected.
Rather than abandoning import duties, the White House pivoted rapidly to alternative statutory authorities. From February 24 through July 24, 2026, officials imposed temporary 10 percent global tariffs under Section 122.
Starting July 24, the administration replaced those temporary duties with 10 to 12.5 percent Section 301 tariffs. By September 2026, the Penn Wharton Budget Model calculated the average effective U.S. tariff rate stood at 6.7 percent as of July, up from 2.3 percent in January 2025.
Broad averages still hid steep targeted barriers for specific industries and trading partners. Penn Wharton found effective tariff rates reached 22.8 percent on Chinese imports and 40.5 percent on steel and aluminum.
Those legal pivots carried massive budgetary consequences. The CBO estimated that the Supreme Court’s IEEPA ruling increases projected 10-year deficits from 2026 through 2036 by $2.0 trillion due to lost customs revenue and refunds.
Yet CBO Director Phillip Swagel noted that lower post-ruling tariff rates helped ease near-term inflation and boosted real GDP. Tracing Section 301 exclusion requests and customs filings lets you see which domestic manufacturers secured protection while importers fought for tariff refunds.
Monetary Policy Tightening Under New Fed Leadership
Fiscal expansion and rising energy prices collided head-on with a major leadership transition at the Federal Reserve. On May 22, 2026, Kevin Warsh became Fed Chair, succeeding Jerome Powell and immediately reshaping how the central bank communicates.
Under Warsh, the Federal Reserve ended traditional forward guidance and moved to trim its schedule of regular rate-setting meetings starting in 2027. Investors could no longer rely on scripted hints weeks before a policy vote.
On September 16, 2026, the Federal Open Market Committee voted unanimously to raise its target range by 25 basis points to 3.75 to 4.00 percent. That move marked the central bank’s first interest rate hike since 2023.
Tensions inside the committee surfaced just six weeks later as growth stayed hot and energy prices spiked. On October 28, the Fed held rates at 3.75 to 4.00 percent in a 10-to-2 vote, with two members dissenting in favor of an immediate hike.
Pressure for tighter credit kept building into November. On November 10, Fed Governor Christopher Waller signaled that another rate increase—potentially 25 or 50 basis points—remained on the table for December.
Bond markets priced in both the Fed’s hawkish turn and Washington’s $2 trillion borrowing appetite. On September 29, 2026, 30-year Treasury yields hit 5.61 percent—the highest level since 2002—while 10-year yields peaked near 5.37 percent in early October.
To trace how borrowing costs filter through regional industries, check the Bureau of Economic Analysis data portal for sector-by-sector investment tables alongside FOMC meeting statements.
Accountability Tracking: Courts, Audits, and the Midterms
Rapid spending and executive trade actions rarely go unchecked for long in the U.S. system. Across 2026, three separate accountability mechanisms—judicial review, nonpartisan budget scoring, and midterm elections—forced course corrections.
Judicial and Budgetary Checks on Executive Tariffs
The Supreme Court’s February 20 ruling established a clear constitutional boundary around emergency tariff powers. Ordering the government to refund most of $166 billion in collected IEEPA duties demonstrated that executive trade orders face strict statutory limits.
From a watchdog perspective, refunding $166 billion creates an urgent transparency test. You can monitor Treasury disbursement reports and corporate quarterly filings to see whether companies receiving tariff refunds pass savings to consumers or boost share buybacks.
Meanwhile, CBO’s November 2026 deficit accounting stripped away rosy revenue projections tied to P.L. 119-21. Putting a $1.992 trillion price tag on FY 2026—and flagging the $2.0 trillion 10-year revenue loss from the tariff ruling—gave lawmakers hard numbers before 2027 budget talks.
Federal transparency also suffered a brief blind spot tied to partisan gridlock. Because an October 2025 federal government shutdown prevented data collection, the Bureau of Labor Statistics could not publish 12-month inflation comparisons in its October 2026 CPI report.
Gaps in baseline statistics make independent auditing harder for taxpayers and investors alike. Whenever shutdowns interrupt federal agencies, cross-referencing private payroll processors, energy spot prices, and Treasury cash statements helps you fill the informational void.
Voter Accountability and Divided Government
If courts audited trade authority, voters audited the real-world affordability of 2026 growth on November 3. Even with 3.4 percent Q3 GDP expansion and strong stock market returns, households punished the governing party for $6 diesel and rising living expenses.
Allianz and Moneyweb analyses linked the Democratic sweep of the House, Senate, and key governorships like Texas directly to gas prices, affordability anxiety, and the Iran conflict. Strong macro headlines could not offset the strain voters felt at checkout counters.
Divided government beginning in January 2027 alters the lobbying and fundraising map across Washington. Industries that relied on one-party control to secure tax expensing or deregulation must now court committee chairs in both parties.
You can watch that political realignment in real time by checking quarterly filings in the Federal Election Commission campaign finance database. Comparing pre-election and post-election donation patterns reveals which energy, tech, and manufacturing PACs are hedging their bets.
For legislative influence, pair campaign records with the OpenSecrets money-in-politics database to inspect which specific bill numbers and agencies trade associations target ahead of the 2027 session.

Public Impact: What You Gained and Lost in 2026
Economic policies are never abstract; they show up on your paystub, your grocery receipt, your utility bill, and your retirement statement. The 2026 American economy delivered tangible wins for workers and investors alongside painful costs for borrowers and lower-income households.
Jobs, Wages, and Market Gains vs. Price Shocks
On the employment front, the U.S. labor market outperformed pessimistic autumn forecasts. On November 6, 2026, the Bureau of Labor Statistics reported employers added 165,000 nonfarm payroll jobs in October, beating estimates of 59,000 to 65,000.
That October hiring burst more than tripled the prior 12-month average of 48,000 jobs per month, while August and September gains were revised upward by 84,000. The unemployment rate dipped to 4.1 percent, holding within a narrow 4.1 to 4.3 percent band since March.
Paychecks also edged higher, with average hourly earnings climbing 3.1 percent year-over-year to $38.00. Because domestic natural gas prices stayed near $3 per MMBtu instead of Europe’s $30-plus levels, U.S. households avoided the extreme heating bills seen abroad.
Investors holding broad U.S. equities saw double-digit gains through mid-autumn. First Financial Trust data show the S&P 500 climbed 11.89 percent year-to-date through October 16, reaching 7,659.44 up from 6,845.50 at the end of 2025.
Those equity returns rested on booming corporate profits, with FactSet reporting 52 percent S&P 500 earnings growth in August. Yet stubborn inflation eroded a sizable chunk of wage gains for everyday families.
BLS data show headline consumer prices rose 3.7 percent over the 12 months through September 2026, accelerating from 3.4 percent in August. A 20.4 percent 12-month surge in energy prices drove that jump, while core CPI rose 2.6 percent.
Momentum did not cool in October, when headline CPI rose another 0.4 percent month-over-month and core inflation climbed 0.3 percent. Although U.S. inflation still beat the IMF’s 4.7 percent global projection, rising fuel and food prices squeezed household budgets.
Hidden Risks to Watch: Rates, Cuts, and AI Valuations
While tax cuts and business expensing lifted disposable income for some taxpayers, P.L. 119-21 imposed steep trade-offs on vulnerable households. Cuts to Medicaid, ACA health credits, SNAP food assistance, and clean-energy incentives shifted real expenses back onto families and states.
Meanwhile, the surge in 10-year Treasury yields near 5.37 percent and 30-year yields at 5.61 percent raised borrowing costs across the board. Anyone shopping for a mortgage, auto loan, or small-business credit line faced significantly steeper interest payments than a year earlier.
Stock investors also learned how fragile AI-driven market gains can be when valuations stretch. On November 5, 2026—two days after the midterm elections—the S&P 500 dropped roughly 4.1 to 4.4 percent while the Nasdaq tumbled 5.5 percent.
Concerns over AI spending returns and post-election policy gridlock triggered that sharp sell-off. The IMF warned that if AI productivity disappoints and hyperscaler capital spending slows, global GDP growth could fall by 1.1 percent by 2028, hitting the United States and Asia hardest.
To protect your own finances, review whether your retirement portfolio has grown overly concentrated in the four hyperscalers driving $720 billion to $745 billion in capex. Locking fixed rates on essential debt before December’s FOMC meeting can also shield you from another potential rate hike.
Money-Trail FAQ: Checking the Facts Yourself
Following trillion-dollar economic stories requires knowing how political spending and public disclosures actually operate. Here are direct answers to four common questions watchdog readers ask when auditing policy money trails.
How does coordinated spending work between campaigns and outside groups?
Federal election law bars candidates and political parties from coordinating strategy, messaging, or ad buys with independent-expenditure committees. When a Super PAC or dark-money group runs ads praising a tax bill, it must operate independently from the candidate’s campaign staff.
In practice, watchdogs watch for common consultants, shared vendors, or candidates posting public wish lists that outside groups mirror. You can spot potential alignment by comparing FEC independent-expenditure timestamps against candidate campaign announcements and committee markup schedules.
Are there limits on Super PAC contributions for corporate or energy donors?
Unlike traditional candidate committees, independent-expenditure-only committees—known as Super PACs—can accept unlimited contributions from individuals, corporations, and labor unions. That legal structure allows major tech firms, energy exporters, or trade associations to pour vast sums into federal races.
However, Super PACs must still file public reports listing the names, employers, and amounts of their donors with the Federal Election Commission. Searching donor names by industry lets you see which sectors backed lawmakers writing tax, tariff, or energy rules.
Where do disclosure gaps hide dark money behind tax and trade bills?
Disclosure gaps often center on nonprofit social welfare groups and trade associations organized under tax rules that do not require public donor lists. These organizations can fund issue advertisements or contribute directly to Super PACs, obscuring the original corporate or individual source.
To bridge that gap, inspect annual IRS Form 990 filings for grants sent between nonprofits and check federal Lobbying Disclosure Act registries. Lobbying filings name the exact firms hired, the dollar sums paid, and the specific bills or agencies targeted each quarter.
Which free watchdog tools let you verify federal economic flows yourself?
You can cross-check nearly every macro claim using free primary government portals before trusting any political talking point. Start with the Bureau of Economic Analysis for GDP and investment components, and the Bureau of Labor Statistics for payrolls, wages, and CPI tables.
Pair those reports with CBO budget analyses, Monthly Treasury Statements for debt and deficit totals, and EIA weekly energy spreadsheets. Combining economic accounts with FEC campaign filings gives you a complete picture linking money in politics to money in the economy.
Watchlist: Key Deadlines and Triggers for 2027
The forces that pushed U.S. growth ahead of the G7 in 2026 face immediate stress tests over the coming months. Keep these specific dates and triggers on your calendar as Washington shifts into divided government.
First, watch the Federal Reserve’s December 2026 policy meeting, where Governor Christopher Waller signaled a 25 or 50 basis point rate hike remains possible. Any additional tightening under Chair Kevin Warsh will quickly test 5.61 percent long-term Treasury yields and corporate capex budgets.
Second, track the Treasury Department’s monthly cash statements as officials disburse refunds for most of the $166 billion in invalidated IEEPA tariffs. Watch whether those outflows widen monthly deficits beyond October’s $404 billion pace and how Section 301 collections perform in comparison.
Third, monitor quarterly corporate earnings from Amazon, Alphabet, Meta, and Microsoft to see if their $720 billion to $745 billion spending pace holds steady. Any pullback in data-center construction would signal early trouble along the IMF’s 2028 AI slowdown risk horizon.
Fourth, follow incoming congressional committee agendas when divided government takes office in January 2027. With debt held by the public at $32.7 trillion and annual interest exceeding $1.14 trillion, tax extensions, spending cuts, and energy export rules will spark immediate fights.
Finally, bookmark the Federal Reserve’s reduced 2027 meeting schedule alongside quarterly FEC and lobbying disclosure deadlines. Watching who funds key committee chairs—and how household inflation responds—will tell you whether America’s 2026 economic lead endures or stalls.