
Fresh polling data reveals a steep slide in President Donald Trump’s approval rating as economic anxiety shakes voter confidence across the country. You are watching core coalitions fracture just ahead of pivotal congressional races.
The latest national surveys place his net support deep underwater, with his overall approval hovering between 30% and 43%. Multiple nonpartisan trackers now confirm second-term record lows across diverse demographics.
This comprehensive update details the newest findings, unpacks the economic drivers behind the shift, and explains what these numbers mean for your community this election season.
Breaking Polling Data: Trump Approval Hits Second-Term Lows
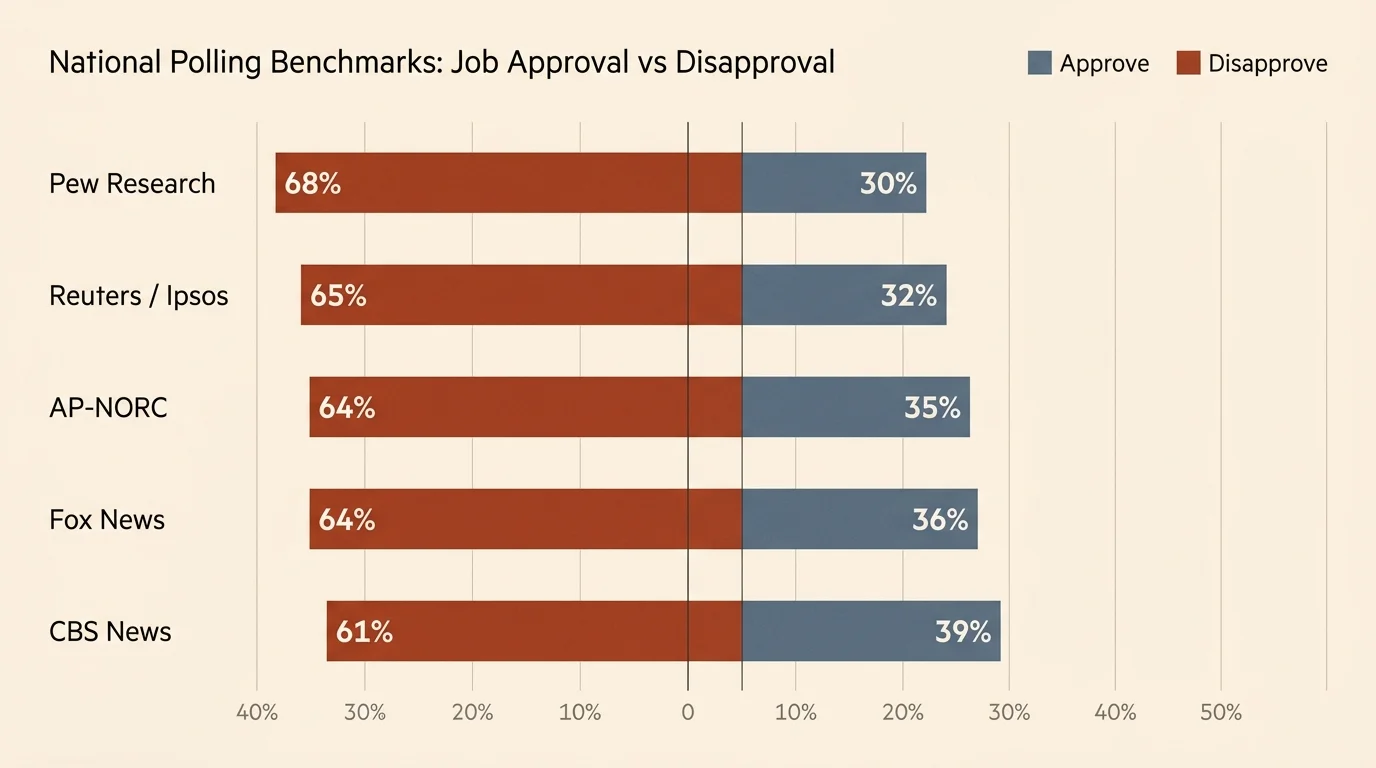
The latest Fox News poll, conducted between October 9 and October 12 and published on October 14, places Trump’s job approval at 36%. Meanwhile, 64% of respondents state that they disapprove of his executive performance.
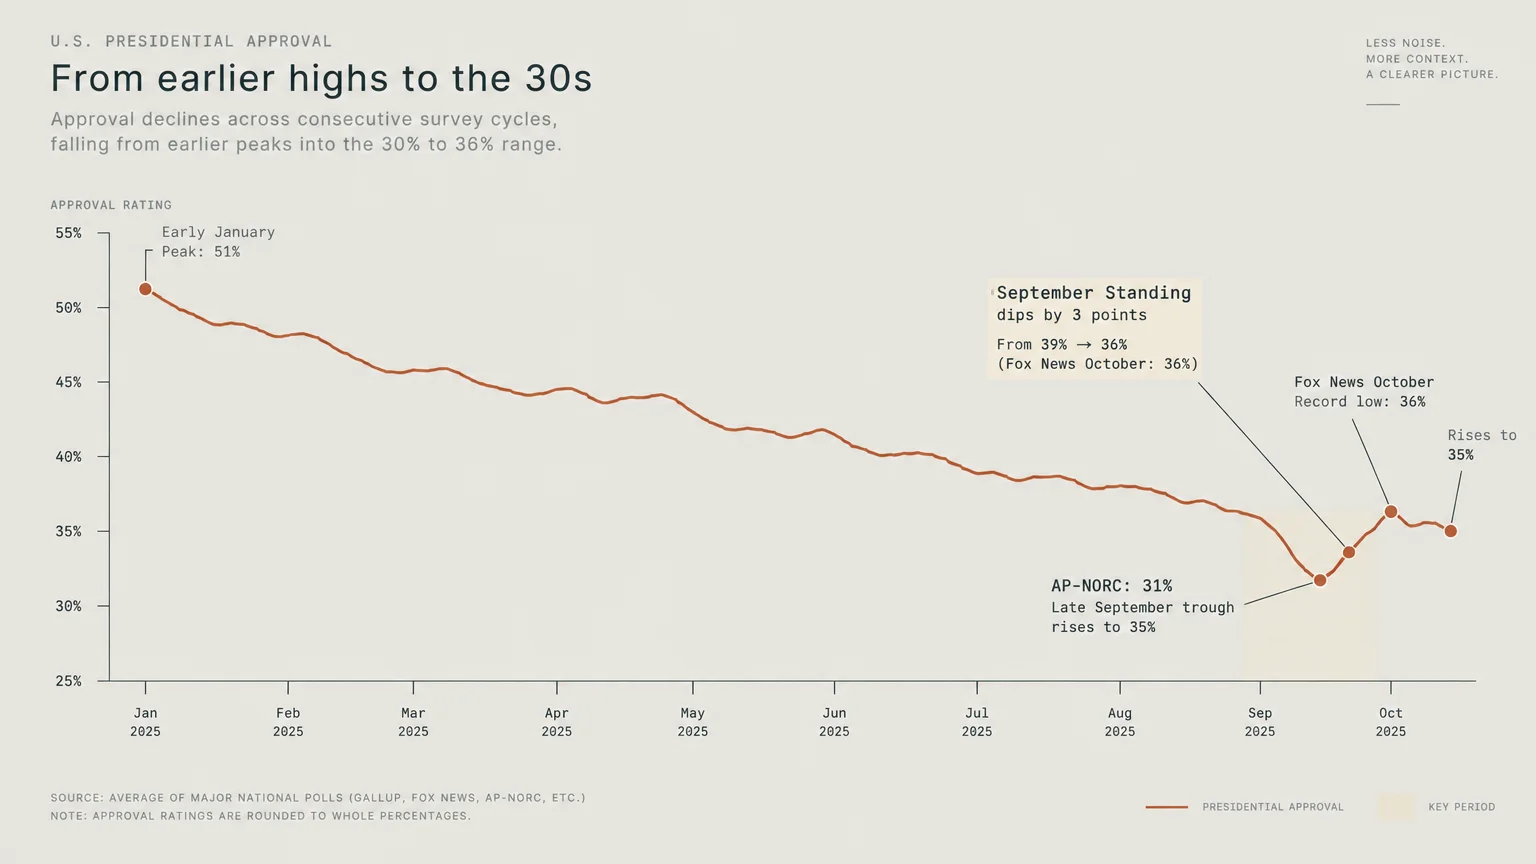
This survey questioned 1,202 registered voters and carries a margin of error of plus or minus 2.5 percentage points. The score marks a notable 3-point drop from his September standing.
More significantly, this result represents the lowest approval rating Fox News has recorded for Trump across either of his presidential terms. The drop signals growing unease among voters who previously supported his agenda.
Concurrently, a national survey from the AP-NORC Center for Public Affairs Research confirms persistent voter skepticism. Conducted from October 8 to October 12, the poll found 35% approval and 64% disapproval.
The AP-NORC survey sampled 1,119 American adults and carries a margin of error of plus or minus 3.9 percentage points. Interestingly, these numbers reflect a minor rebound from the pollster’s late September findings.
In that late September AP-NORC poll, Trump’s approval dropped to 31% while disapproval climbed to 69%. Even with this 4-point recovery, the administration remains heavily underwater with the general public.
Pew Research and Reuters Reveal Substantial Voter Defection
Data from the Pew Research Center poll presents an even steeper challenge for the White House. Conducted from September 28 through October 4, the survey recorded a second-term low of 30% approval.
In that same Pew survey, 68% of respondents expressed disapproval of Trump’s presidential performance. This result marked a 4-point decline from earlier polling cycles conducted by the organization.
Pew Research sampled 5,062 adults, giving the study an exceptionally tight margin of error of plus or minus 1.6 percentage points. The large sample size reinforces the reliability of the observed downward trend.
A large-scale Reuters and Ipsos survey conducted from September 30 to October 5 produced similarly striking results. That poll recorded 32% approval against 65% disapproval among 4,506 American adults.
With a narrow margin of error of plus or minus 1.5 percentage points, the Reuters and Ipsos survey underscores deep national discontent. The findings suggest that voter dissatisfaction spans across multiple geographic regions.
The CBS News and YouGov poll conducted between September 30 and October 2 aligns with these negative benchmarks. In a survey of 2,166 adults, 39% approved of Trump’s performance while 61% disapproved.
That CBS News survey carried a margin of error of plus or minus 2.5 percentage points. It shows that roughly six out of ten citizens express dissatisfaction with executive leadership.
Contrasting Results from Rasmussen Reports and RMG Research
While most national organizations report approval in the low 30s, select survey firms report higher numbers. Findings published on October 15 by Rasmussen Reports recorded 43% approval and 56% disapproval.
That result leaves Trump with a net approval score of -13 percentage points. While underwater, this measurement indicates a firmer foundation than media-sponsored adult polls indicate.
Similarly, RMG Research published survey results on October 15 showing 41% approval alongside 58% disapproval. That reading places Trump’s net approval deficit at -17 points.
The divergence between these firms and other pollsters often stems from sampling methodology. Rasmussen and RMG regularly screen for likely voters, who historically hold more conservative political views than the general public.
The Economist and YouGov Structural Breakdown
The Economist and YouGov poll conducted from October 10 to October 12 offers valuable insight into voter intensity. Among adult citizens surveyed, 39% approved of Trump’s job performance, while 57% disapproved.
When you examine the enthusiasm behind those responses, an intensity imbalance becomes apparent. Only 16% of respondents reported that they strongly approved of the president’s performance.
Another 23% indicated that they somewhat approved of his actions in office. Meanwhile, only 4% of participants stated that they were unsure about their opinion of executive leadership.
This low undecided figure shows that public sentiment has hardened firmly across the country. You are seeing an electorate that has already rendered a clear preliminary judgment on the administration.
Context Bar: Tracing the Second-Term Polling Trajectory
Understanding these latest poll results requires examining how Trump’s public standing has evolved over his second term. When he took office in January 2025, his national approval rating stood at 47%.
That initial baseline reflected a divided country, yet gave the White House operational room to advance major initiatives. However, over the past twenty-one months, public support has steadily eroded across nearly every demographic category.
The FiftyPlusOne polling aggregate, managed by former FiveThirtyEight analysts, now calculates his weighted average at 34.8% approval. Disapproval in that composite benchmark reaches 61.9%, creating a net deficit of -27 points.
Aggregators provide vital clarity because they combine multiple surveys while weighting each firm for historical accuracy. The aggregate confirms that Trump’s support has plateaued between 35% and 37% over recent months.
The Softening of the 2024 Base Coalition
The most alarming development for the White House involves declining enthusiasm among its core political base. Data from the Pew Research Center reveals an unprecedented erosion among voters who supported Trump in 2024.
In October 2026, only 67% of people who voted for Trump in 2024 approved of his job performance. This marks a sharp drop from the 95% approval he enjoyed among this group in January 2025.
The decline followed a continuous downward trend throughout the current election year. Approval among his 2024 voters stood at 83% at the start of 2026, before sliding to 75% in July.
Losing nearly thirty points of support within your own base creates immense governing challenges. When core voters lose enthusiasm, fundraising drops and grassroots volunteer mobilization weakens ahead of crucial congressional contests.
Historical Midterm Headwinds for Second-Term Presidents
History shows that second-term presidents almost universally struggle during their first midterm elections. Voters often experience governing fatigue and place blame on the party in power for intractable national problems.
When approval numbers dip below 40%, the president’s ability to defend vulnerable congressional seats diminishes rapidly. Under these conditions, midterm races frequently become referendums on the administration rather than local contests.
You should expect opposition candidates to exploit this dynamic across every competitive district in the nation. They will tie local incumbents directly to the president’s most unpopular executive decisions.
Economic Pessimism: The Primary Catalyst for the Slump
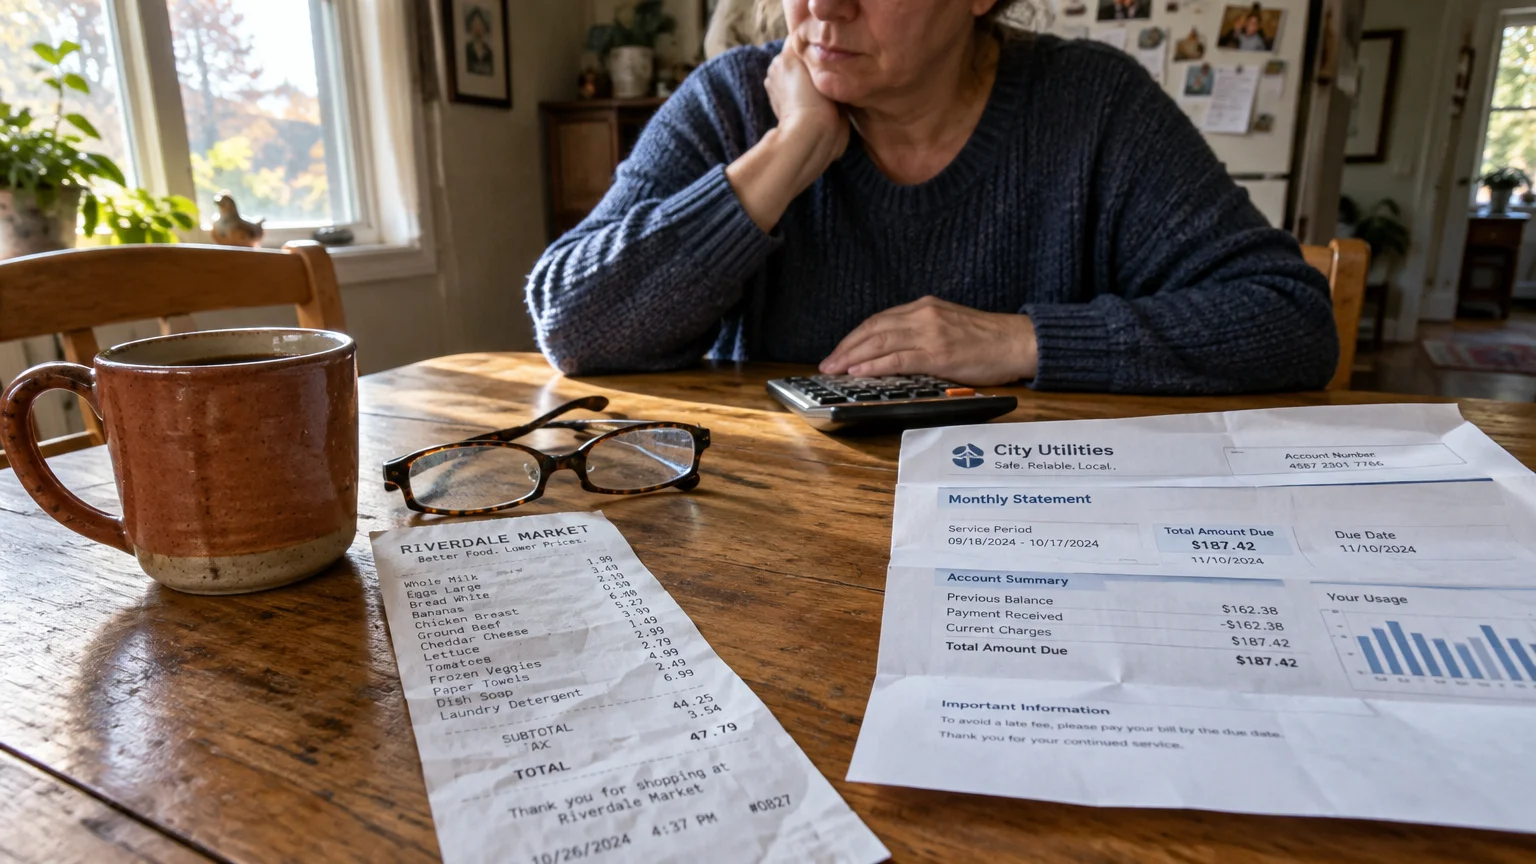
Economic anxiety stands out as the single most powerful factor depressing the president’s poll numbers. In the Fox News poll, 74% of registered voters rated current economic conditions as negative.
Furthermore, 66% of surveyed voters expressed broad dissatisfaction with the direction of the country. When asked about their top economic worry, six in ten respondents identified affordability and daily living costs.
You feel these cost pressures directly when paying for groceries, utility services, and housing. Even when macroeconomic indicators show resilience, voters judge economic success by their own monthly checking account balances.
Recession Fears and Independent Discontent
Persistent inflation concerns have fueled widespread fears of a deeper economic downturn. An exclusive survey published on October 15 by The Guardian and Harris exposed dramatic voter pessimism.
The poll revealed that 61% of Americans mistakenly believe the nation is currently in an economic recession. This widespread perception highlights a severe disconnect between official agency reporting and public sentiment.
Independent voters have responded to these pressures by turning sharply against the current administration. In the Guardian and Harris survey, 65% of independent voters stated that the economy is actively getting worse.
Because independents decide competitive elections across swing districts, their pessimistic outlook poses an existential threat to Republican majorities. Without winning a substantial share of independent voters, defending purple districts becomes nearly impossible.
Waning Confidence Among Republican Voters
The economic pessimism recorded by pollsters is no longer confined to Democrats and independents. The Guardian and Harris study discovered a substantial erosion of economic confidence inside the Republican Party itself.
Only 28% of surveyed Republicans said that the national economy is currently improving. This represents a dramatic decline from February 2026, when 49% of Republicans expressed optimism about the economy.
When more than seventy percent of a president’s own party questions economic progress, defensive political strategies become necessary. The White House must now spend valuable campaign resources reassuring its traditional supporters.

Reactions and Strategic Responses Across Washington
The release of these consecutive low poll numbers has triggered immediate strategic adjustments across Washington. The White House press office continues to emphasize long-term economic plans and administrative regulatory rollbacks.
Administration spokespersons insist that structural policy changes require several quarters to deliver measurable consumer relief. However, selling patience to voters proves exceptionally difficult during an intense midterm election cycle.
Congressional Republican Tactical Adjustments
On Capitol Hill, Republican lawmakers are pursuing distinctly different strategies depending on their local electorates. Members representing deeply conservative districts continue to embrace the president to ensure maximum turnout among base voters.
In contrast, lawmakers facing tight re-election battles in suburban swing districts are actively distancing themselves from executive actions. These candidates are emphasizing bipartisan accomplishments and local infrastructure investments rather than White House policy.
This growing tactical split complicates party discipline on major legislative votes. You will likely see party leaders avoid controversial floor votes that could force moderate members into uncomfortable positions.
Democratic Campaign Mobilization
Democratic campaign organizations have launched aggressive messaging blitzes centered on kitchen-table economics. Party leadership views the president’s polling weakness as an opportunity to reclaim congressional majorities.
Their campaign advertisements focus heavily on consumer prices, healthcare expenses, and corporate profits. By highlighting widespread economic dissatisfaction, Democratic candidates hope to build an expansive coalition of disaffected voters.
The Electoral Stakes: Generic Ballots and Midterm Outcomes
The president’s low approval ratings are translating directly into dangerous deficits on the generic congressional ballot. In the October Fox News poll, Democrats opened a nine-point advantage over Republicans, leading 54% to 45%.
This nine-point margin among registered voters represents a formidable obstacle for the GOP as it defends its House majority. A lead of that size typically signals widespread political realignment across competitive congressional districts.
The RealClearPolitics early October average confirms this national trajectory. Their composite metric shows Democrats leading the generic congressional ballot by 7.8 percentage points.
Historically, when the opposition party holds a generic ballot lead above five points in October, substantial seat gains follow. You are seeing the classical statistical warning signs of a potential midterm wave election.
Suburban Battlegrounds and Turnout Dynamics
The battle for congressional control will ultimately be decided in affluent suburban districts across key swing states. These districts contain high concentrations of college-educated voters and political independents who reject economic instability.
If independent voters continue to report economic dissatisfaction at current rates, suburban Republican incumbents face daunting odds. Campaign operatives in both parties are shifting advertising budgets heavily toward these decisive suburban media markets.
Governance and Policy Ramifications of the Slump
Depressed approval ratings do not just affect upcoming elections; they also impair everyday governance. When a president’s approval sits below 35%, his political leverage on Capitol Hill diminishes sharply.
Opposition lawmakers have no political incentive to negotiate compromises on contentious judicial appointments or budget packages. Even allied legislators often hesitate to support ambitious executive initiatives when their constituents express deep dissatisfaction.
Administrative Pivots to Unilateral Authority
Presidents facing congressional resistance typically turn toward executive orders and agency regulations to advance their priorities. You should expect the White House to rely increasingly on unilateral executive actions in the coming months.
However, executive actions face rigorous scrutiny in federal courts and can be overturned by future administrations. This reality creates regulatory uncertainty for business leaders and investors who must plan long-term capital commitments.
Diplomatic Standing on the Global Stage
Domestic political weakness also reverberates across international relations and foreign policy negotiations. World leaders closely track American presidential approval numbers to gauge an administration’s long-term staying power.
Allied nations may become hesitant to enter into binding agreements if they believe congressional power will shift dramatically. Meanwhile, geopolitical adversaries often test an administration when domestic political crises consume the executive branch.
How to Audit Political Polls: A Step-by-Step Voter Guide
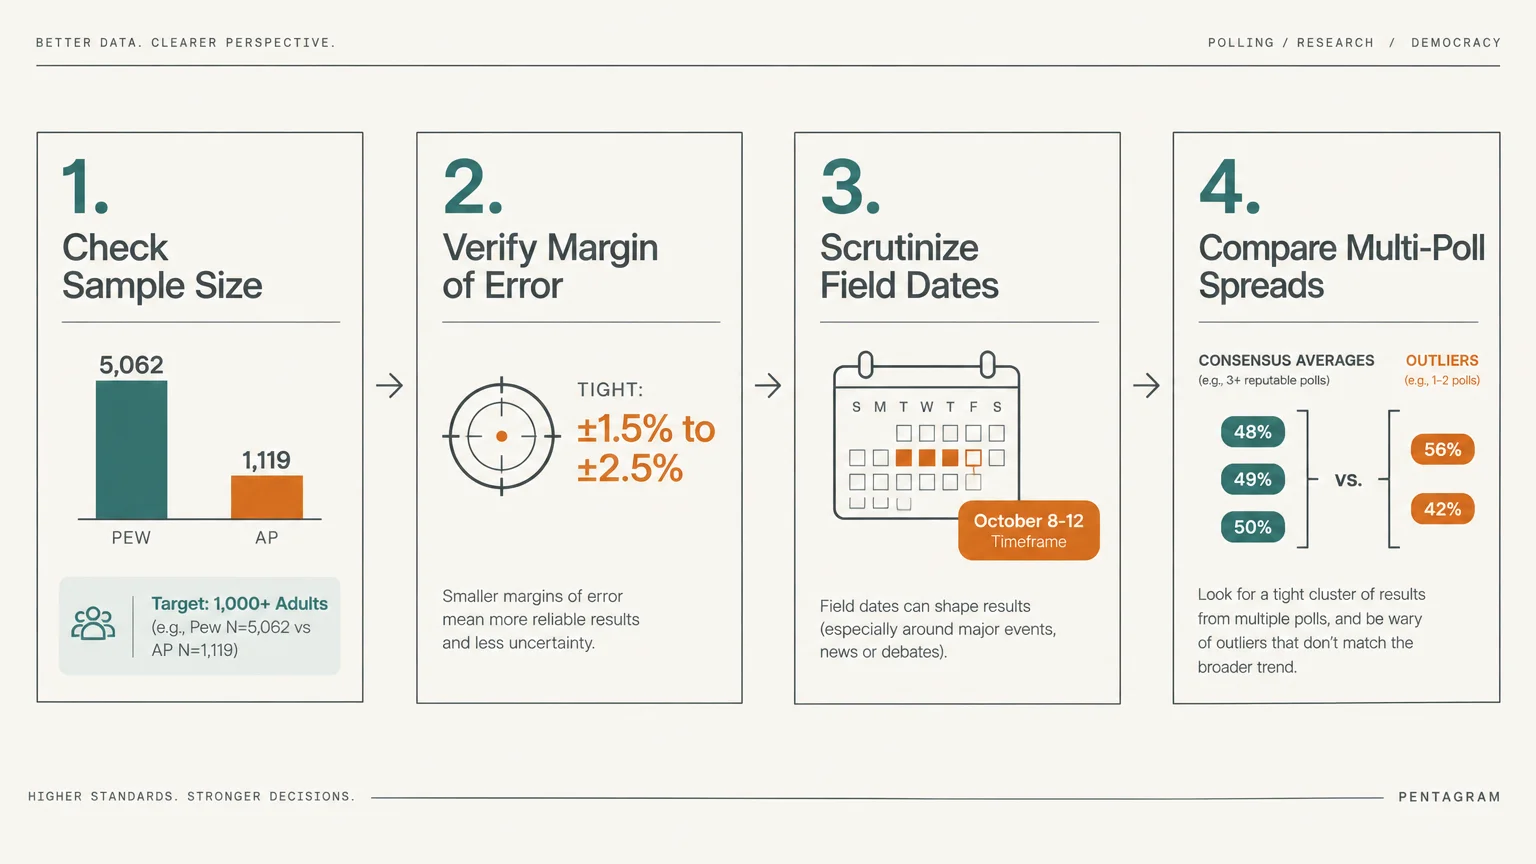
Navigating conflicting political poll results requires a critical eye and a structured evaluation process. You can protect yourself from sensationalized headlines by applying four essential audit steps to every new survey release.
Examine the Sample Universe
Always verify whether a poll surveys adult residents, registered voters, or likely voters. Surveys of all adults reflect general social sentiment but often overstate opposition to conservative officeholders.
In contrast, likely voter screens provide the most accurate barometer for upcoming election results. Make sure you know which group the pollster surveyed before drawing firm electoral conclusions.
Check the Margin of Error and Sample Size
Every legitimate poll publishes a margin of error based on its overall sample size. A survey of 5,000 respondents, like the Pew study, carries a small margin of plus or minus 1.6 percentage points.
Conversely, a smaller survey often carries a margin of error approaching plus or minus 3.9 percentage points, as seen in the AP-NORC study. You should never interpret minor point shifts within that margin as definitive proof of political change.
Analyze Question Wording and Polling Mode
The precise wording of a polling question can significantly influence participant responses. Objective surveys use neutral language that avoids leading questions or emotionally charged descriptors.
Additionally, consider how the pollster collected data, whether through live telephone interviews, online panels, or text messages. Multi-modal surveys combining several collection methods generally produce more representative samples of modern voters.
Rely on Composite Polling Aggregates
Never formulate your political expectations based on a single isolated poll release. Individual polls can represent statistical outliers due to temporary sampling anomalies or unique weighting models.
Tracking weighted averages like the FiftyPlusOne aggregate provides a much more stable and realistic assessment. Aggregates filter out erratic noise and reveal genuine long-term movements in public opinion.
Frequently Asked Questions About Trump Approval Ratings
What is Donald Trump’s current average approval rating?
Trump’s weighted polling average currently sits at 34.8% approval and 61.9% disapproval, according to the FiftyPlusOne aggregate benchmark. This composite metric gives the president a net approval rating of -27 points.
Across individual surveys published in mid-October 2026, his approval numbers range from a low of 30% in Pew Research to 43% in Rasmussen Reports. The general average continues to hover between 35% and 37%.
Which polling organization shows Trump with his lowest numbers?
The Pew Research Center recorded the administration’s lowest rating, showing Trump at 30% approval and 68% disapproval among 5,062 adults. This result represented a 4-point decline from previous Pew research findings.
Reuters and Ipsos also recorded a very low mark of 32% approval against 65% disapproval among 4,506 surveyed adults. Both surveys featured large sample sizes with exceptionally narrow margins of error.
Why are Trump’s poll numbers slipping among his 2024 voters?
Pew Research found that approval among 2024 Trump voters has fallen to 67%, down from 95% at the start of his term. Economic frustration represents the primary driver behind this loss of base support.
In recent polling, 74% of voters rated economic conditions negatively, and six in ten identified affordability as their primary worry. When daily living expenses strain household budgets, base enthusiasm deteriorates significantly.
How do these approval ratings impact the upcoming 2026 midterm elections?
These low approval numbers create severe electoral challenges for Republicans defending their congressional majorities. In the Fox News poll, Democrats lead the generic House ballot 54% to 45% among registered voters.
Furthermore, RealClearPolitics reports an average Democratic advantage of 7.8 percentage points. If these numbers hold through November, Republicans face substantial seat losses across battleground districts.
What to Monitor Next: Critical Dates and Upcoming Milestones
The definitive test for these polling trends will occur on November 3, 2026, when Americans cast their midterm ballots. That vote will determine party control of both congressional chambers for the remainder of the presidential term.
Between now and election day, you should monitor official government releases tracking consumer price trends and unemployment numbers. Because economic anxiety drives voter dissatisfaction, any shifts in economic data will directly influence closing poll numbers.
You should also observe how individual candidates manage their campaign schedules in tight battleground races. Watch whether vulnerable incumbents invite the president to campaign with them or choose to hold independent local rallies.
Candidate appearance schedules provide an authentic indicator of private internal campaign polling. When candidates quietly decline national surrogate appearances, you can deduce that local numbers mirror national headwinds.
Check your local voter registration status immediately to ensure your ballot remains secure and active. Engaging with primary sources and verified polling data empowers you to participate effectively in upcoming national decisions.
Staying informed through objective, multi-source tracking ensures you understand the political shifts shaping your community. The final weeks of this election cycle will test whether executive policy can adapt to clear voter feedback.


